2023 marked another year of record growth in CVE data, and I thought it fitting to kick off the new year by delving into these statistics and showcasing some of the more interesting data points.
CVEs By The Numbers
We ended 2023 with 28,902 published CVEs, up over 15% from the 25,081 CVEs published in 2022.
On average, there were 79.18 CVEs published per day.
October was the month with the most CVEs published, with 2,690 or 9.3% of all CVEs for the year.
Tuesdays were the top publishing days, with 6,438 CVEs or 22.3% of all CVEs published.
January 26th had the most CVEs published in a single day, with 348.
CVEs By Month
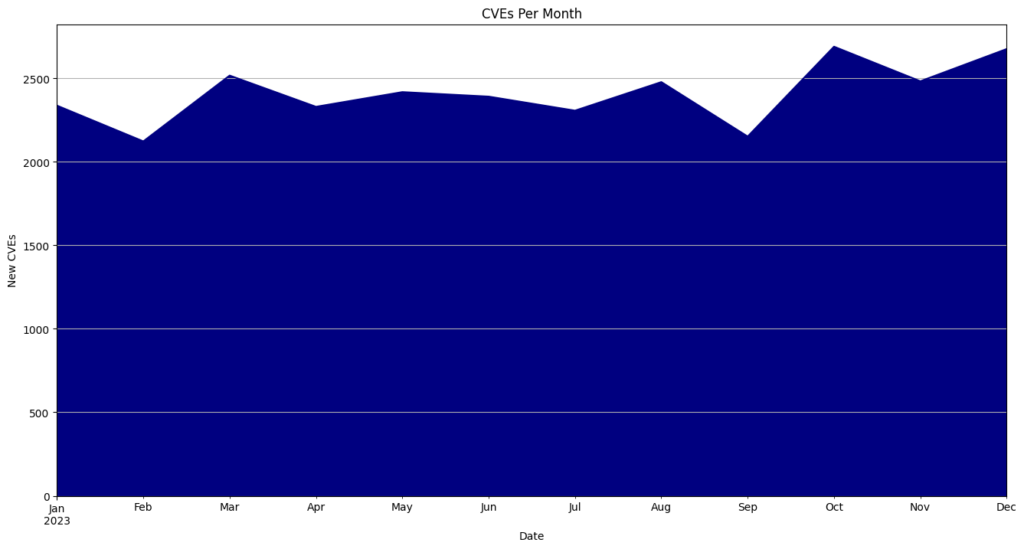
| Month | CVEs | Percentage |
|---|---|---|
| January | 2337 | 8.1 |
| February | 2123 | 7.3 |
| March | 2517 | 8.7 |
| April | 2330 | 8.1 |
| May | 2418 | 8.4 |
| June | 2391 | 8.3 |
| July | 2307 | 8.0 |
| August | 2478 | 8.6 |
| September | 2152 | 7.4 |
| October | 2690 | 9.3 |
| November | 2483 | 8.6 |
| December | 2676 | 9.3 |
CVEs By Day Of The Week
| Day | CVEs | Percentage |
|---|---|---|
| Monday | 5005 | 17.3 |
| Tuesday | 6438 | 22.3 |
| Wednesday | 5895 | 20.4 |
| Thursday | 5064 | 17.5 |
| Friday | 4597 | 15.9 |
| Saturday | 1006 | 3.5 |
| Sunday | 897 | 3.1 |
Top 10 CVE Publishing Days
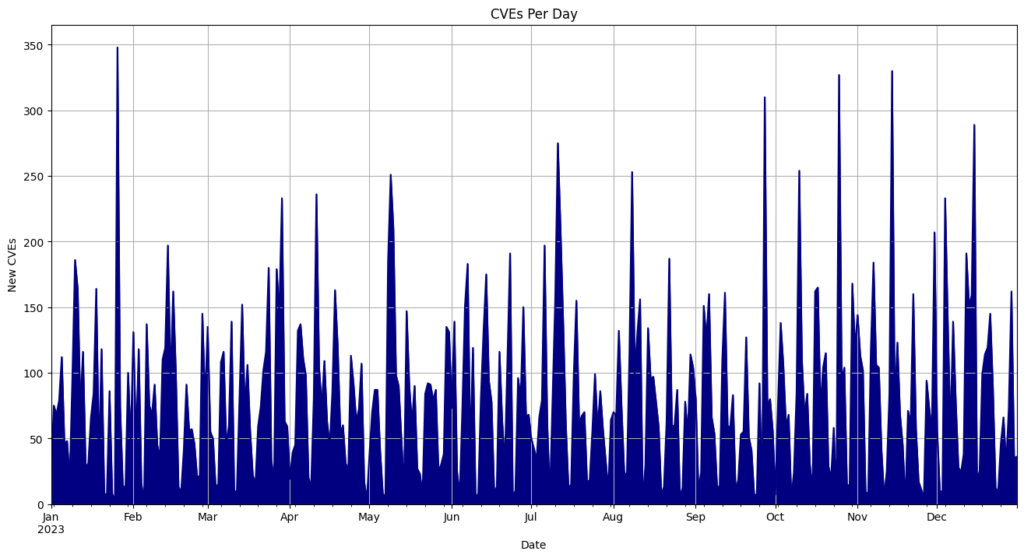
| Day | CVEs |
|---|---|
| 2023-01-26 | 348 |
| 2023-11-14 | 330 |
| 2023-10-25 | 327 |
| 2023-09-27 | 310 |
| 2023-12-15 | 289 |
| 2023-07-11 | 275 |
| 2023-10-10 | 254 |
| 2023-08-08 | 253 |
| 2023-05-09 | 251 |
| 2023-04-11 | 236 |
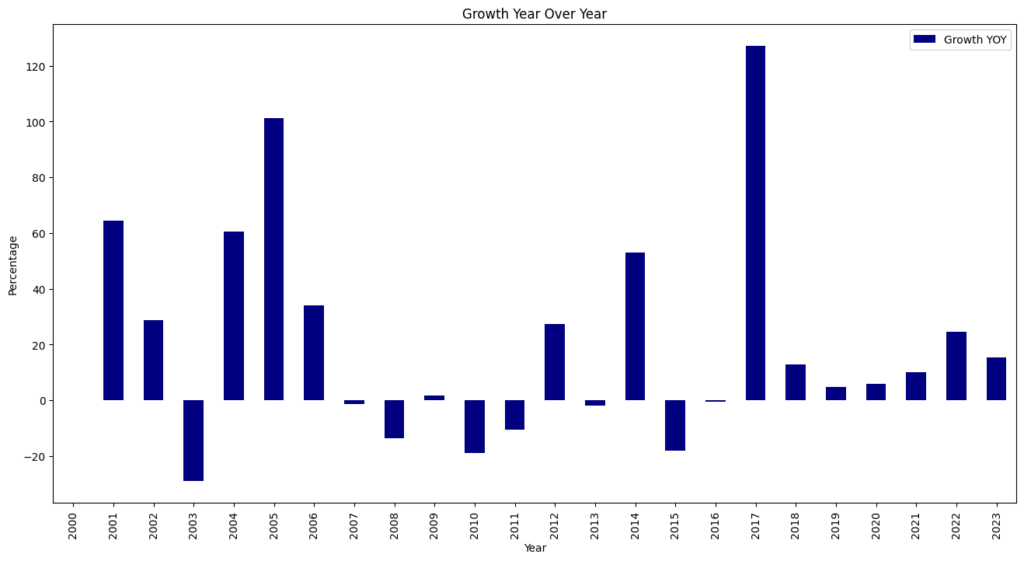
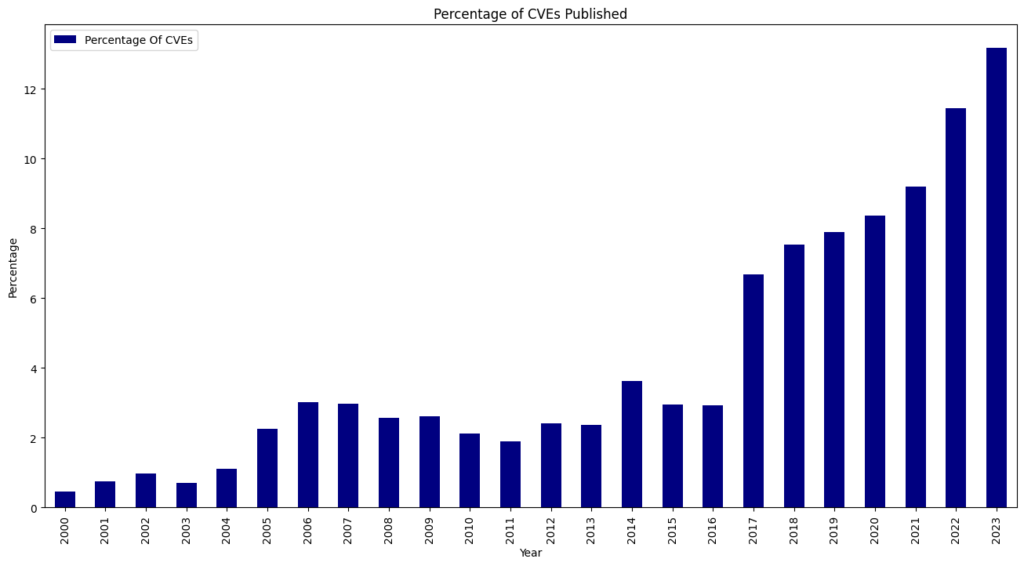
CVE Growth
Like every year since 2017, we saw a record-breaking number of CVEs published, with 28,902. a 15.23% increase over 2022. It also means that 13.18% of all CVEs published were published in the last year.
CVSS
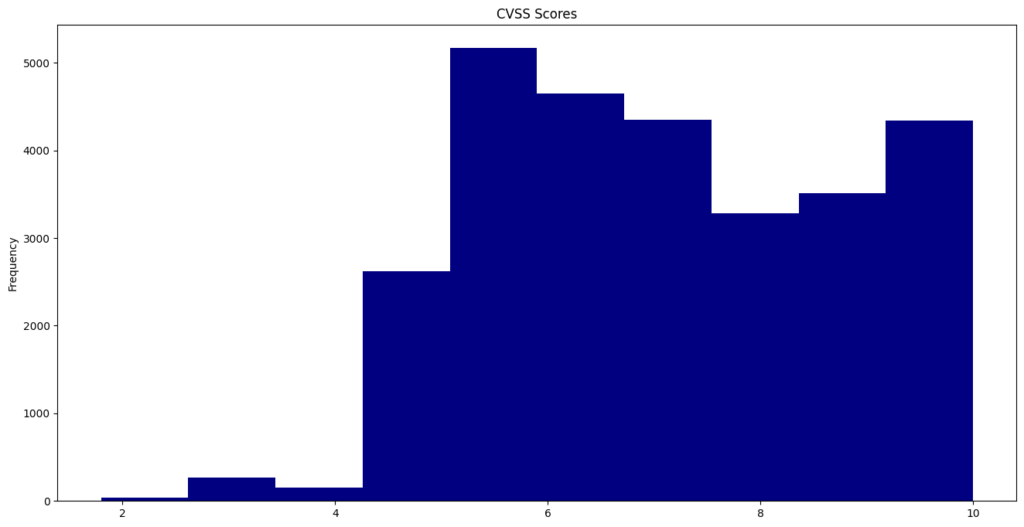
The Common Vulnerability Scoring System (CVSS) provides a way to capture the principal characteristics of a vulnerability and produce a numerical score from 0.0 to 10.0, reflecting its severity. The average CVSS score this year was 7.12.
This year, 36 CVEs scored a “perfect” 10.0.
CVE-2023-21928 had the lowest published CVSS score of 1.8.
CPE
Common Platform Enumeration (CPE) is a structured naming scheme for information technology systems, software, and packages to help identify vulnerable software identified in a CVE.
This year, 3,119 unique CPEs were identified in CVEs. The most common was cpe:2.3:o:google:android:12.0:*:*:*:*:*:*:* that was applied to 547 CVEs.
CVE-2023-44183, a Juniper Networks Junos OS vulnerability, is the CVE with the most CPEs with 240 unique, vulnerable configurations.
CNA
CVE Numbering Authorities (CNAs) are software vendors, open source projects, coordination centers, bug bounty service providers, hosted services, and research groups authorized by the CVE Program to assign CVE IDs to vulnerabilities and publish CVE Records within their specific scopes of coverage.
Today, there are 346 CNAs. This year, 250 of those CNAs published at least one CVE.
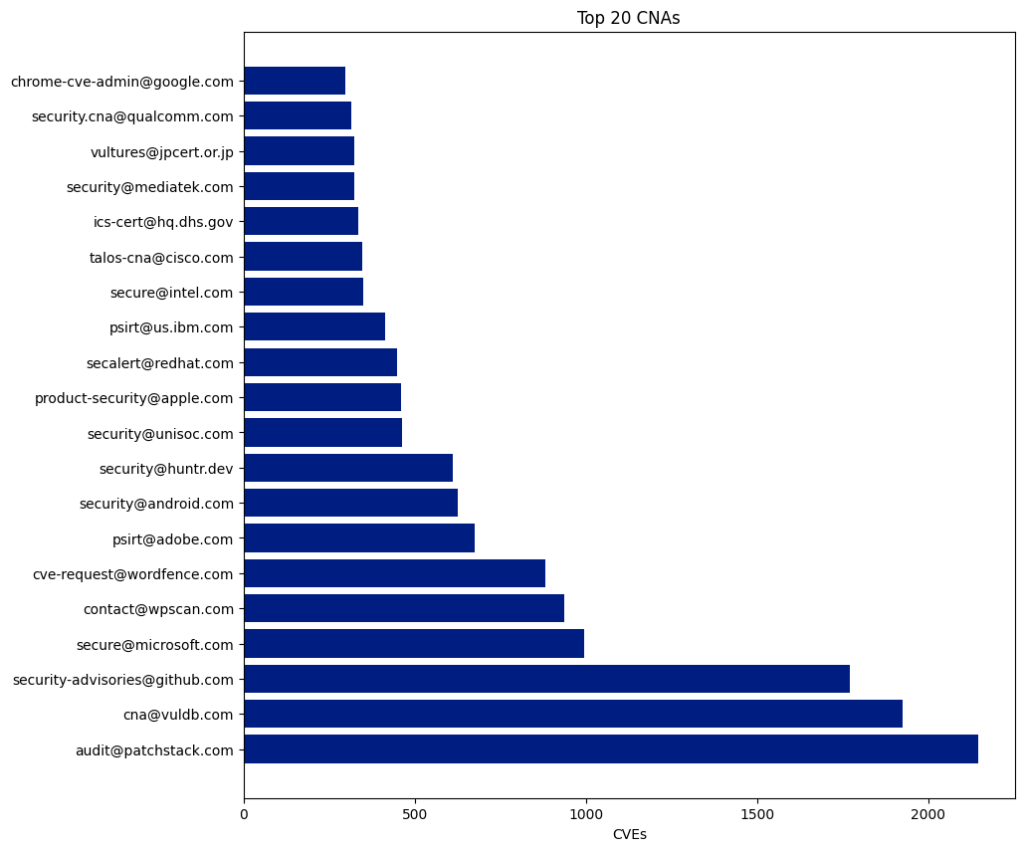
The Top 5 CNAs last year were:
Patchstack
VulDB
Github
Microsoft
WPScan
Four of the top five CNAs this year, excluding Microsoft, were purpose-built to report CVEs for open-source projects (VulDB & Github) or WordPress Plugins (Patchstack & WPScan). Those four CNAs published 6,778, or 24.12% of all CVES this year.
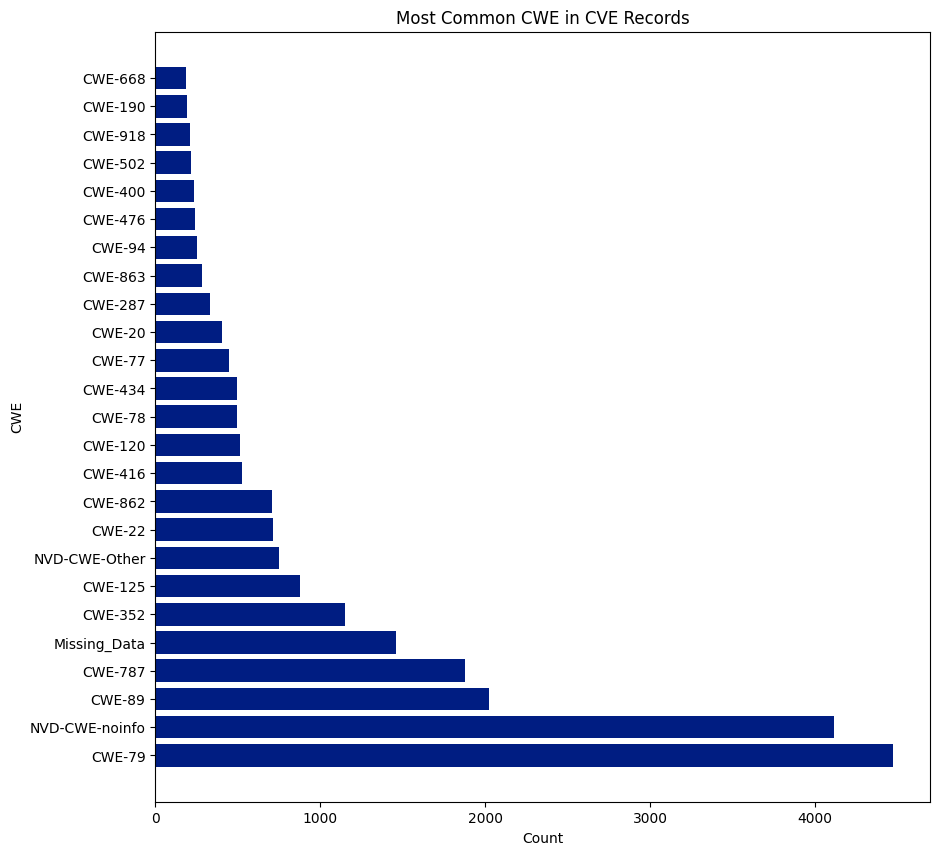
CWE
CWE is a community-developed list of software and hardware weakness types. It is a common language, a measuring stick for security tools, and a baseline for weakness identification, mitigation, and prevention efforts.
There are 1,332 CWEs, and 237 were assigned to CVEs this year. CWE-79 was the most assigned CWE and was assigned 4,474 times or 15.48% of all CVEs. NVD didn’t assign a CWE 4,113 times or 14.23% of all CVEs.
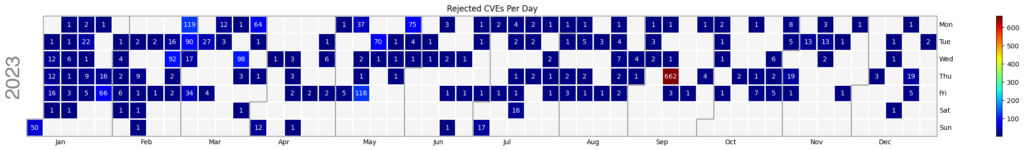
Notes
2,112 Rejected CVEs have been removed from the dataset because some CNAs publish and reject any unused reserved CVE IDs, causing an artificially inflated record count. On September 14th alone, 662 were published and then immediately rejected.
This GitHub repository has jupyter notebooks containing all the data and visualizations used in this blog.
CVE.ICU is an open-source project I run that tracks most of the above data points in real-time throughout the year if you are interested in keeping up with the data.